Has the Fed Won Its War Against Inflation?

-
 August 20, 2024
The Federal Open Market Committee (FOMC) of the Federal Reserve (Fed) met at its regularly scheduled meeting on July 30-31 and voted to keep the overnight Fed Funds rate at 5.25-5.50%. This was the eighth straight meeting the FOMC voted to keep the rate unchanged. The FOMC’s official statement acknowledged the slowing job market, slightly increasing unemployment rate, and stated it “judged the risks to achieving its employment and inflation goals continue to move into better balance.” In the follow-up press conference, Fed Chairman Jerome Powell indicated the Fed would be positioned to begin cutting the Fed Funds rate at the September meeting if recent economic trends continue.
In the week following the meeting, weaker economic reports caused the bond market to rally in price. These reports included unemployment rising another 0.2% to 4.3%, a level not seen since December 2021; a weaker than expected nonfarm payrolls report with major downward revisions; and weaker increases in average hourly earnings. This led the United States Treasury rates to significantly decline as the market now believes the Fed should have begun the process of lowering rates at the July meeting.
The futures market in Fed Funds is pricing in four to six cuts of 0.25% each by year-end. However, this same Fed Funds futures market priced in six rate cuts for 2024 in December 2023 and there have not been any as of early August. Just as the Chicago Board of Trade sometimes overshoots the futures price of corn on both the upside and the downside, it does with interest rate futures prices as well. For the Fed to cut interest rates so quickly would require a major, severe disruption in the US economy that would likely turn into a recession.
The graph below shows a 10-year history of the Fed Funds rate:

For a longer perspective, the graph below spans nearly 70 years of the Effective Fed Funds Rate:
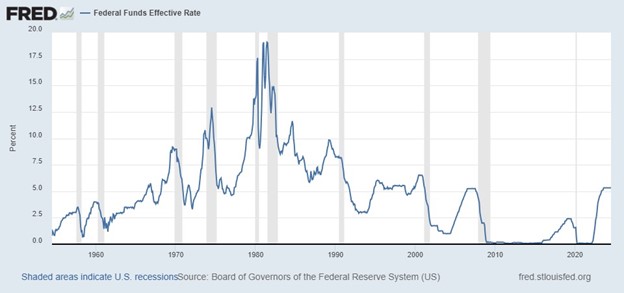
The rapid increases in the Fed Funds rate beginning in March 2022 has been significant because of the fast-paced rate of increases off such a low base rate. This created economic pain for businesses that borrow money on a short-term basis to finance inventory and receivables, as well as crop expenses for farmers, as there was no time to adjust to the much higher interest costs. However, for a longer-term perspective, the current Fed Funds rate is similar to, if not lower than, the average of the 1970’s, 1980’s and 1990’s.
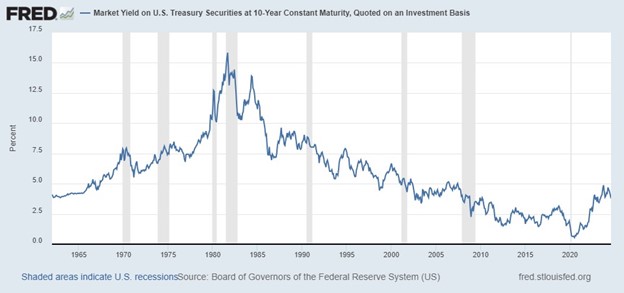
To show that various interest rates are correlated, below is a graph of the 10-year U.S. Treasury (UST) rates since 1962. While the 10-year UST rates are not directly tied to the Fed Funds rate, there is a similar shape over time to the general movement of the longer-term rates and Fed Funds rates:
The most likely trend in short-term rates now appears to be down, although it won’t likely be recognized until this fall. Adjustable and fixed-term loan rates are more directly impacted by the bond market than the FOMC’s interest rate decisions and have already begun to moderate. Short-term rates are being held up by the Fed currently but will move downward once the Fed decides to reduce the Fed Funds rate to a more neutral level. If you have long-term loans that were priced in the last 12-18 months, this fall may be a good time to discuss re-pricing options with your FCI loan officer. We do indeed live in INTERESTing times!
-
Tag Cloud
employees balance sheet Essentials Newsletter rural marketplace investment Financials FOMC land sales Focus on Farming calendar security scholarships Weather Farm Credit College Auction Results cash flow patronage Interest Rates Education farmland auctions liquidity Community Improvement Grants appraisals Land Classes FFA Calendar contest Land Values Weather Outlook 4-H Farm