Farmland Value Benchmark Study Results

-
 August 9, 2023
 Featured
Each year the Farm Credit Illinois (FCI) appraisal team evaluates the same 20 benchmark farms throughout its 60-county territory based on the land’s productive index (PI) rating, as calculated by the University of Illinois’ Bulletin 811. Based on individual PI ratings, farms are divided into four categories: 1A, 2B, 3C Central, and 3C South.
Farmland Average Values Inch Even Higher in 2023
According to Farm Credit Illinois’ annual benchmark study, farmland values in the central and southern 60 counties of Illinois increased for the fifth consecutive year. On average, the benchmarks were up 8.1%. While this sets a new peak for the study, 2023 values increased more moderately than reported in 2022.
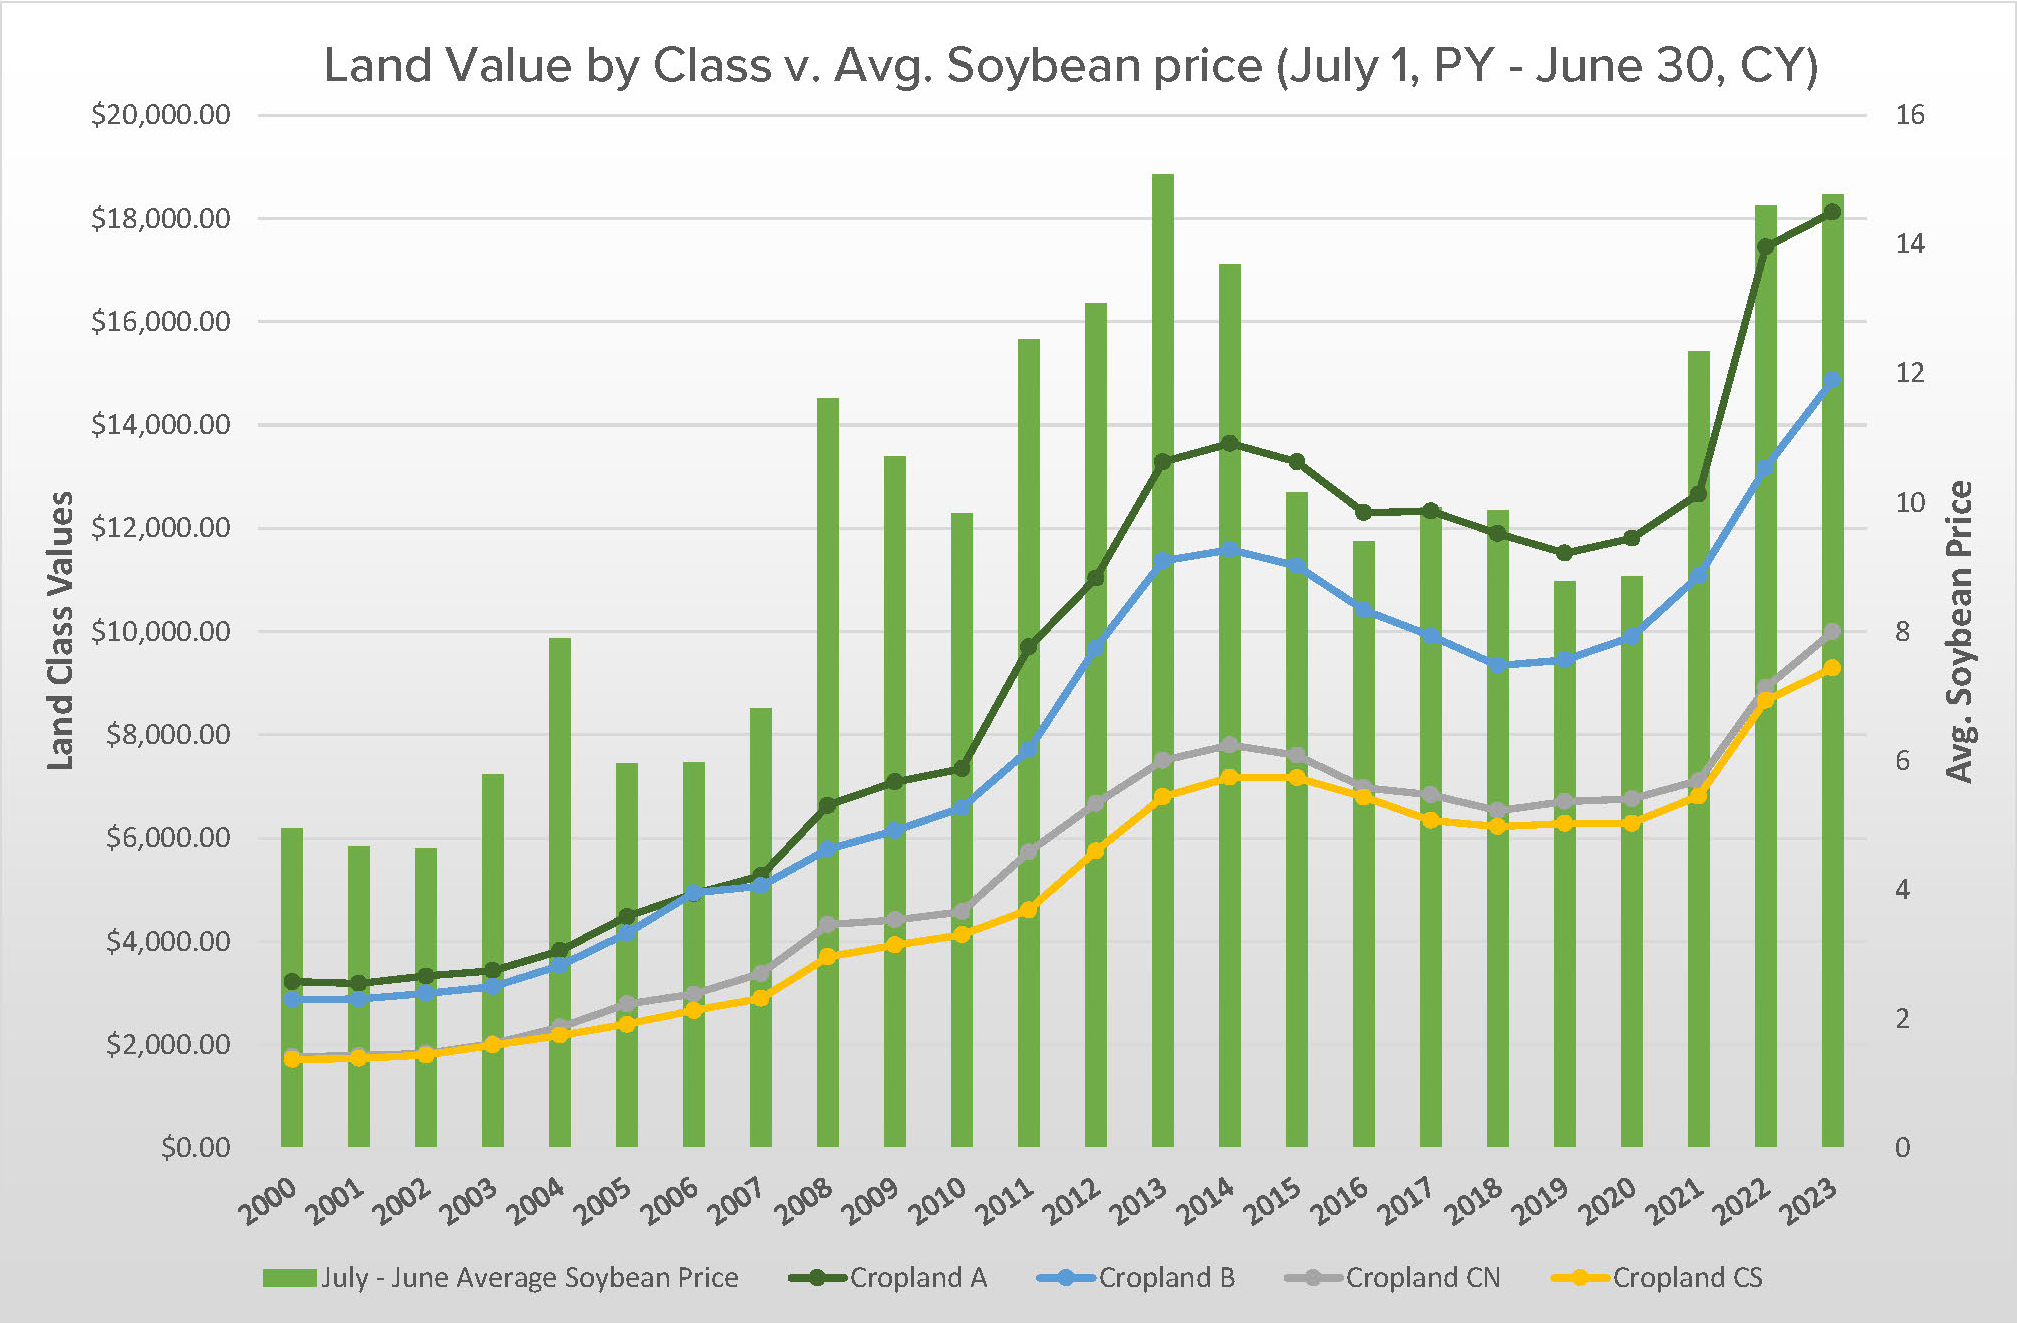
As seen in Figure 1, land values had a dramatic run-up beginning in 2003, until peaking in 2014. The first decline in more than a decade began in 2015 and continued a slight decline through 2018. From that point, land values increased again for five consecutive years, setting new highs in 2023.
Figure 1
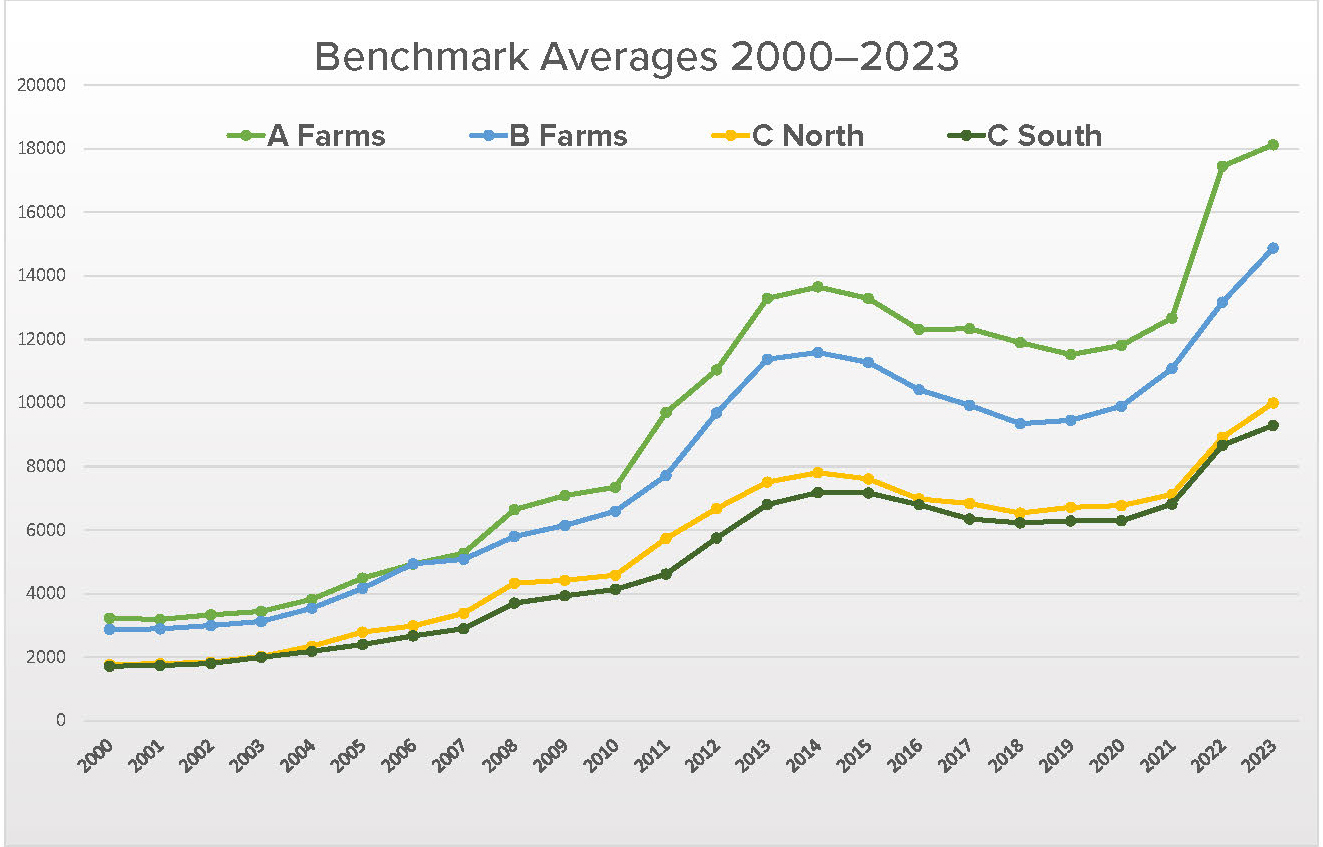
Figure 1: FCI’s average benchmark study results by land class on July 1, 2000-2023. Source: FCI 2023 farmland value benchmark study
Benchmark analysis revealed a statistically stable land market in 2019 with a change of +0.2%. Influenced by strong commodity prices beginning in fall of 2020, land values increased by 2.1% in 2020, 8.5% in 2021, and a substantial 27.9% in 2022.
The 2023 study reflected an average increase of 8.1% with 15 of 20 benchmark farms increasing in value.
Results across all land classes showed considerable variation, reinforcing that agricultural real estate is a location-specific asset. When considering the individual benchmarks values, the year-over-year percentage changes ranged from -5.3% to +31.3%.
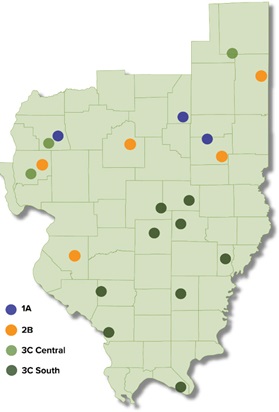
Table 1 illustrates the average changes in the four general land classifications. Class 1A and 2B benchmark farms are mostly located in central Illinois, whereas the Class 3C farms are located in both central and southern Illinois. These farms are tracked separately based upon their location. Benchmark farms are plotted and categorized by land class on the map to the left.
Table 1
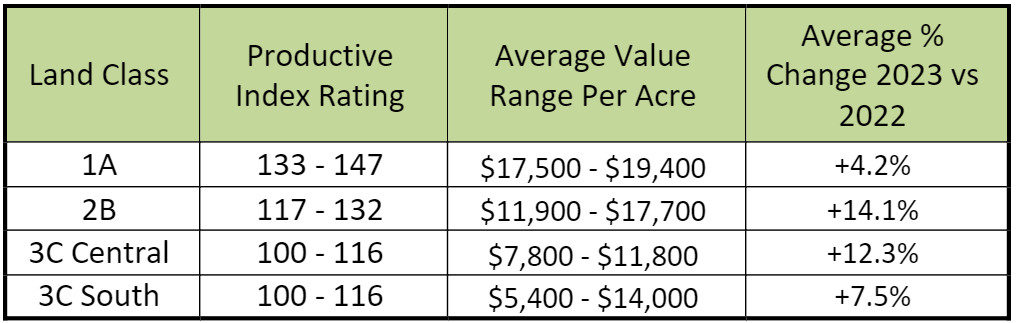
Table 1: Average percent change in overall value since 2022 by land class. Source: FCI 2023 farmland value benchmark study
Commodity Prices in Relation to Land Values
While commodity prices have retreated from their previous high levels at the writing of this report, the past year’s market continued influencing the increase in farmland values. Higher commodity prices also helped fuel the dramatic increase in land values from 2009-2014, and lower commodity prices lead to declining values from 2015-2018. Figures 2 and 3 demonstrate the relationship between land values and corn and soybean prices.
Figure 2
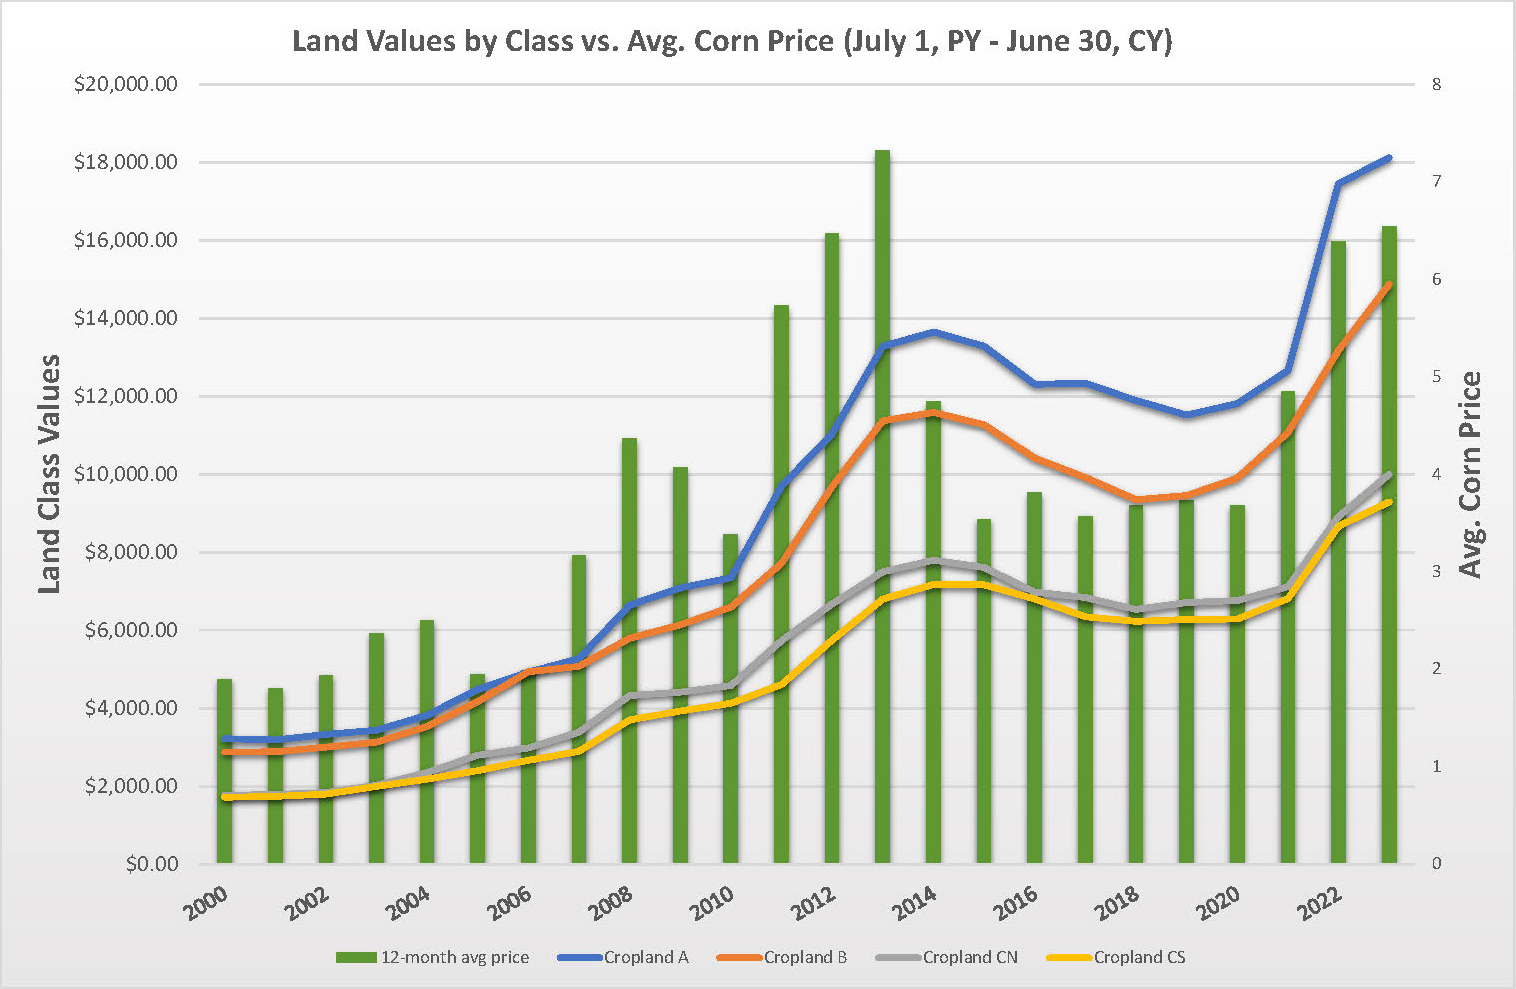
Figure 3
Other Factors Affecting Land Values
Strong demand for Illinois farmland, coupled with limited supply of farms for sale remain primary factors in land values. Buyers are a mix of operating and retired farmers, experienced farmland investors with ties to the area, and some outside investors.
In addition to strong commodity prices, as stated above, Market Facilitation Payments and coronavirus assistance programs from the federal government like the Paycheck Protection Program helped stabilize balance sheets, increase working capital, and create a more positive outlook in agriculture.
Rising interest rates have not yet affected farmland values.
Crop conditions throughout the FCI territory are mixed. Illinois corn conditions reported July 30, 2023, by the USDA show 7% Excellent, 42% Good, 32% Fair, 12% Poor, and 7% Very Poor. Soybeans are rated at 7% Excellent, 39% Good, 34% Fair, 12% Poor, and 8% Very Poor.
Cash Rental Trends
Overall, the estimated cash rents of the benchmark farms increased for the third year in a row. Table 2 illustrates the variation in changes by land class and represents the range of anticipated cash rents for the benchmark farms by land class. Cash rents are highly influenced by the local market and vary greatly within a land class. In conducting the benchmark study, the estimated values reflect the overall picture from the past year and anticipates cash rents that will be negotiated this fall. Benchmark analysis estimates cash rents will trend higher in 2023.
Table 2
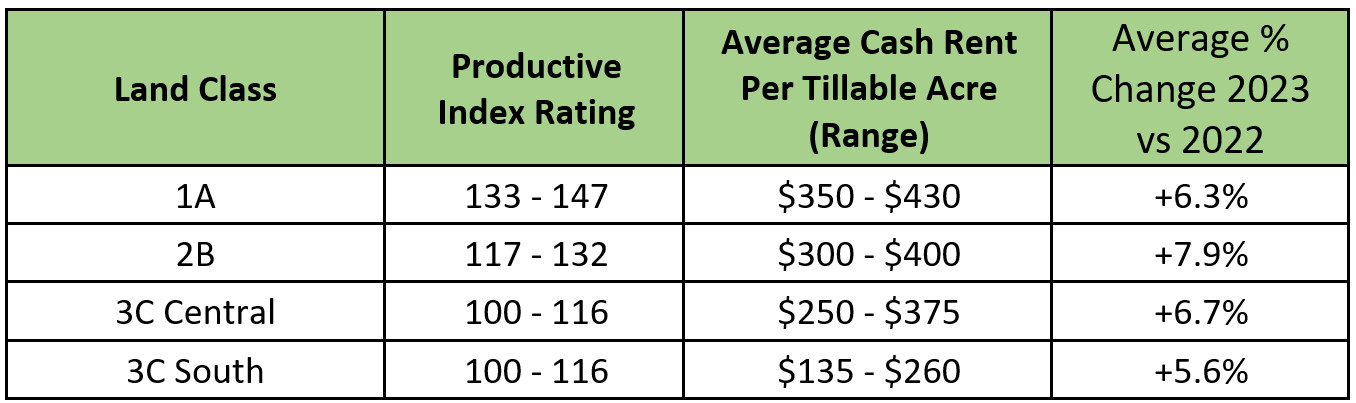
Table 2: Average percent change in overall cash rent since 2022 by land class. Source: FCI 2023 farmland value benchmark study
Summary
The 2023 benchmark update for the Farm Credit Illinois territory shows continued strength in the farmland market. Fifteen of the 20 benchmarks increased in value with only one benchmark farm showing a slight decline. The variability of increases in the FCI territory reinforce that agricultural land is a location specific asset.
The economic health of farmers and farm owners is mostly stable, but there are still pressures on farmers’ financial positions. Increasing interest rates, rising cash rents, and fluctuations in commodity prices will be a challenge for the upcoming year.
Overall, an increase of 8.1% indicates a solid market throughout FCI’s 60-county territory. Farmland values hit record highs in 2023 and all signs indicate they will remain at this level in the near-term.
-
Tag Cloud
Auction Results FreshRoots 4-H Interest Rates FFA FOMC Farm Credit College Financials Land Values Calendar contest INTERESTing Times Land Classes Focus on Farming calendar appraisals Weather employees Community Improvement Grants KOHL-laborations Essentials Newsletter balance sheet cash flow Directors Cup land sales